More on Video Preemphasis and Deviation Calibration
by
J. R. Mathison, WB9OQM
This writing is inspired by the articles by Bill Parker (W8DMR)
in ATVQ's Fall 1998 issue on pages 14 - 19. I would like to
compliment Mr. Parker on his well written articles and the
excellent graphics. I would also like to comment on a couple
things and expand on others.
My following references to European standards is actually to CCIR
Recommendation 576-1 and my references to North American standards
are to EIA/TIA 250-C. Make special note that the European
standards for all measurements on 'video' is not composite as it
does NOT include sync. The North American standard for measurement
on 'video' is composite. Component values contained in the ATVQ
figure on page 17 indicate CCIR Recommendation 405-1 for the
preemphasis standard.
In the figure containing the graphs of curves on page 19, the
deemphasis curve is indeed the compliment of the preemphasis curve.
However, the fact that it had to be shifted upwards by approx 6 db
in order to get it to cross the preemphasis curve at 762 Khz should
indicate to us that something is wrong! That something is the fact
that the crossover point is NOT at 762 Khz. This is a myth so
prevalent that it is believed by many experts in FM TV. The
crossover is at 400 Khz and actually has no significance for FM TV
deviation calibration procedures. The 762 Khz point on the curve
is called the 'relative 0 db reference level' which only has
deviation calibration significance for European standards. Any
other significance for the 762 Khz point is that it is a published
point on the preemphasis curve.
A sine wave does not represent the complex video waveform. A much
more appropriate waveform is a square wave with rise and fall times
of 125 nanoseconds. The 125 ns is the standard for the pedestal -
white transitions of both European and North American standards.
The square wave should be 100/140 volt or 0.715 volt pk-pk assuming
a standard composite video level of 1.0 volt pk-pk. The pulse and
bar with sync from a video test signal generator is even better.
Be sure to strap the unit for 125 nanoseconds rise and fall times.
 A sine wave which has significance for preemphasized video is 1.0
volt pk-pk at 2.333 Mhz. It is no coincidence that this test tone
at 1.0 volt pk-pk goes through the preemphasis network at exactly
the same level as the 0.715 volt square wave. Yes, the passive
preemphasis network has gain!. It is a differentiating network and
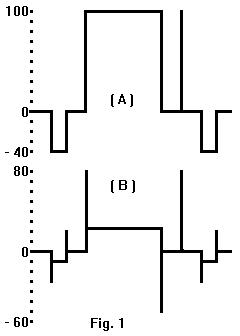
has gain for the square wave. If you display the resulting waveform
on a waveform monitor, set the bottom edge of the square wave
portion to 0 IRE, and you will find the top edge of the square wave
portion is at approx 23 IRE and the leading edge is a narrow spike
standing up to 80 IRE and the trailing edge is a spike dropping
down to minus 60 IRE. The preemphasis network has a voltage gain
of 140/100 for the 0.715 volt pk-pk square wave making it exactly
equal to the 1.0 volt pk-pk at 2.333 Mhz sine wave through the
preemphasis network. One must take special note that the addition
of sync to the above square waveform will NOT cause the peak to
peak amplitude to increase nor the deviation to increase. See my
drawing in Fig 1 (A) for a video signal generator waveform prior to
preemphasis. Fig 1 (B) is this waveform after passing through the
preemphasis network.
A sine wave which has significance for preemphasized video is 1.0
volt pk-pk at 2.333 Mhz. It is no coincidence that this test tone
at 1.0 volt pk-pk goes through the preemphasis network at exactly
the same level as the 0.715 volt square wave. Yes, the passive
preemphasis network has gain!. It is a differentiating network and
has gain for the square wave. If you display the resulting waveform
on a waveform monitor, set the bottom edge of the square wave
portion to 0 IRE, and you will find the top edge of the square wave
portion is at approx 23 IRE and the leading edge is a narrow spike
standing up to 80 IRE and the trailing edge is a spike dropping
down to minus 60 IRE. The preemphasis network has a voltage gain
of 140/100 for the 0.715 volt pk-pk square wave making it exactly
equal to the 1.0 volt pk-pk at 2.333 Mhz sine wave through the
preemphasis network. One must take special note that the addition
of sync to the above square waveform will NOT cause the peak to
peak amplitude to increase nor the deviation to increase. See my
drawing in Fig 1 (A) for a video signal generator waveform prior to
preemphasis. Fig 1 (B) is this waveform after passing through the
preemphasis network.
It is also no coincidence that the first Bessel null of the 2.333
Mhz test signal represents a deviation calibration of 5.6 Mhz peak
which is the 'standard' for composite video under European
standards whether preemphasis is used or not. Those of us who
work with commercial FM TV have been using that test signal for
years to calibrate microwave radio systems which carry FM TV under
European standards, which are extensively used even in this
country. The deviation for video with sync removed is 100/140 of
the 5.6 Mhz peak or 4.0 Mhz. The deviation of the preemphasized
signal does not decrease from the 5.6 Mhz peak even if the sync is
removed because the presence or not of sync does NOT change the
peak to peak amplitude of the preemphasized signal. The problem
now is how does one get 4.0 Mhz peak deviation for 'video' when
removal of sync changes nothing? One of my expert advisors for a
previous article was a high ranking official on the EIA
Subcommittee for Television Transmission Systems. This gentleman
had been a member during the early 1970's when North American
standards adopted CCIR Recommendation 405. He said it was the need
to get 4.0 Mhz peak for 'video' out of the above which led to the
'relative 0 db reference point' on the preemphasis curve. He also
said it was an attempt at comparison of a sine wave to a square
wave. A 762 Khz test signal through the preemphasis network is
100/140 of the square wave or composite video or the 2.333 Mhz test
signal. 100/140 of 5.6 Mhz is the necessary 4.0 Mhz peak
deviation. Had the European standard for measurements on 'video'
included the sync, this devious 'relative 0 db reference level'
would have been unnecessary. It is the cause of universal
misconception concerning the true nature of the deviation of an FM
carrier modulated by 'video'.
ATVQ page 18 describes a well known deviation calibration procedure
for FM TV. The first Bessel null of the 0.46 volt pk-pk at 762 Khz
test signal through the preemphasis network yields a deviation of
1.833 Mhz peak. Increasing the level to 1.0 volts pk-pk causes a
deviation of 4.0 Mhz peak for the 762 Khz test signal. A test
signal of 1.0 volts pk-pk at 2.333 Mhz through the preemphasis
network will be 140/100 higher or 5.6 Mhz peak deviation. This is
exactly the same result as the calibration for European standards
which I described above. The results for the square wave or for
composite video are also the same. Why not use the first Bessel
null of the 2.333 Mhz test signal to begin with? Why are we using
European standards at all when North American standards are more
conservative of RF spectrum?
Preemphasis for video is fully as important as an RF bandwidth
reduction scheme as it is for noise reduction. Video as an
asymmetrical waveform has a DC component. The change from a white
picture to a black picture changes the DC component by
approximately 0.54 volt. The deviation calibration described above
results in a deviation of ll.2 Mhz pk-pk per volt. The change in
DC component causes a deviation of approximately 6 Mhz pk-pk in
addition to that required by a static picture. Use of preemphasis
will reduce the level of the change in DC component by a factor of
approximately 6.2 and the modulation by the DC component to
approximately 960 Khz pk-pk. This is a savings of over 5 Mhz pk-pk
deviation and approximately that much in RF bandwidth. This is a
very significant RF bandwidth reduction for the dynamic waveforms
of video moving pictures.
ATVQ pages 17 and 18 contain a 'formula' for RF bandwidth. This is
actually 'J.R. Carson's Rule' which is a 'rule of thumb'. In this
case it is presented as a mathematical formula yielding results
correct to a one-tenth decimal place. This 'formula' would also
lead one to believe that it is the high frequency components of
video which cause the widest RF bandwidth. The numbers which we
would plug into this 'formula' are the same as above whether
preemphasis is used or not. We find that it is actually the
reduction in the lowest frequencies (by using preemphasis) which
cause the RF bandwidth reduction NOT the highest frequencies as
implied by this 'formula'. Its application is more suited to a
baseband signal which has more nearly equal amplitudes of sine
waves from its lowest to highest frequencies and no changing DC
component. Its use may accurately predict RF bandwidth in some
cases but be in significant error in others.
Please see my articles Comments on Commercial FM TV Standards in
ATVQ-Winter 1994 and FM Video Deviation in ATVQ-Spring 1994 for
more on the above.
-
- Please send E-Mail to: mathison (aatt) sdf-eu.org
- .
- Last revision 2012-12-15